Overview
Today, we're excited to introduce Frontend Monitoring by Highlight — a growing suite of tools that let you analyze how your web app is performing.
Starting today, Frontend Monitoring will launch with two major features: Web Vitals and Performance Metrics.
Web Vitals
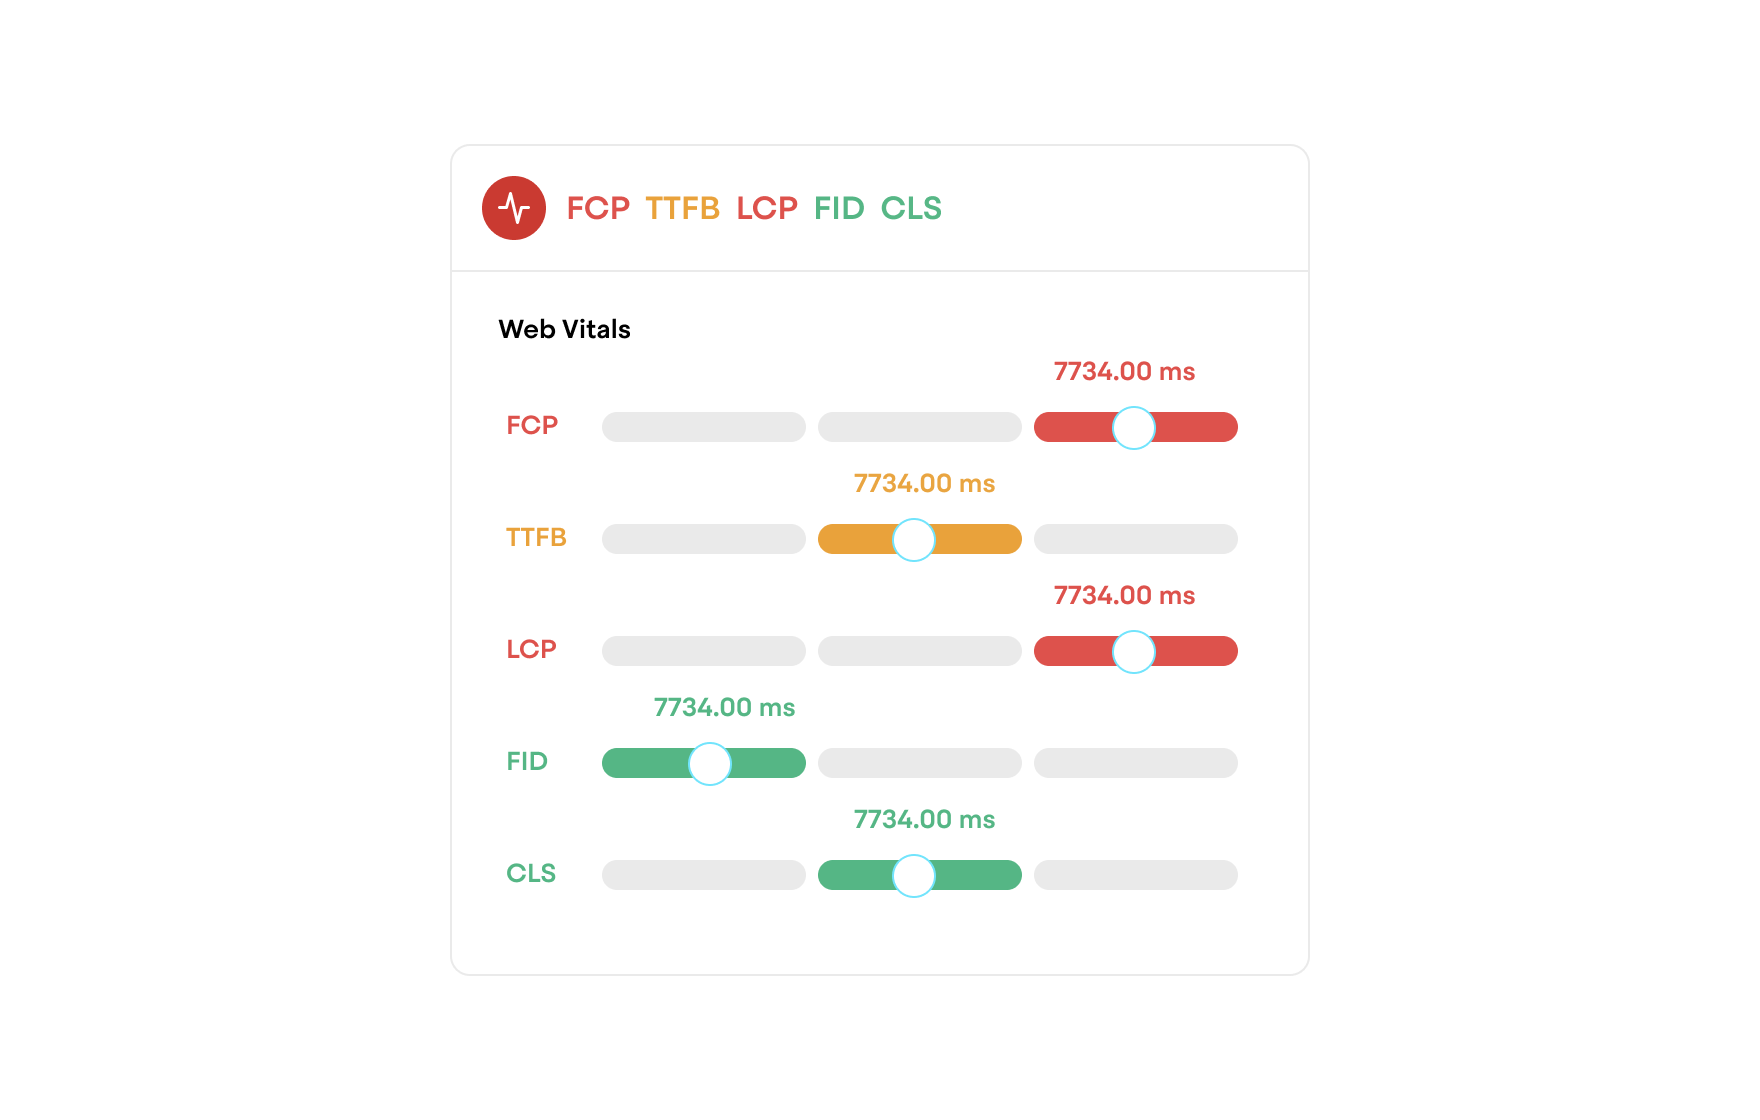
With Web Vitals in Highlight, you can track the three primary web vitals (Largest Contentful Paint, First Input Delay, and Cumulative Layout Shift) directly in Highlight.
Highlight records web vitals for each user session, so you can understand the app performance for each session.
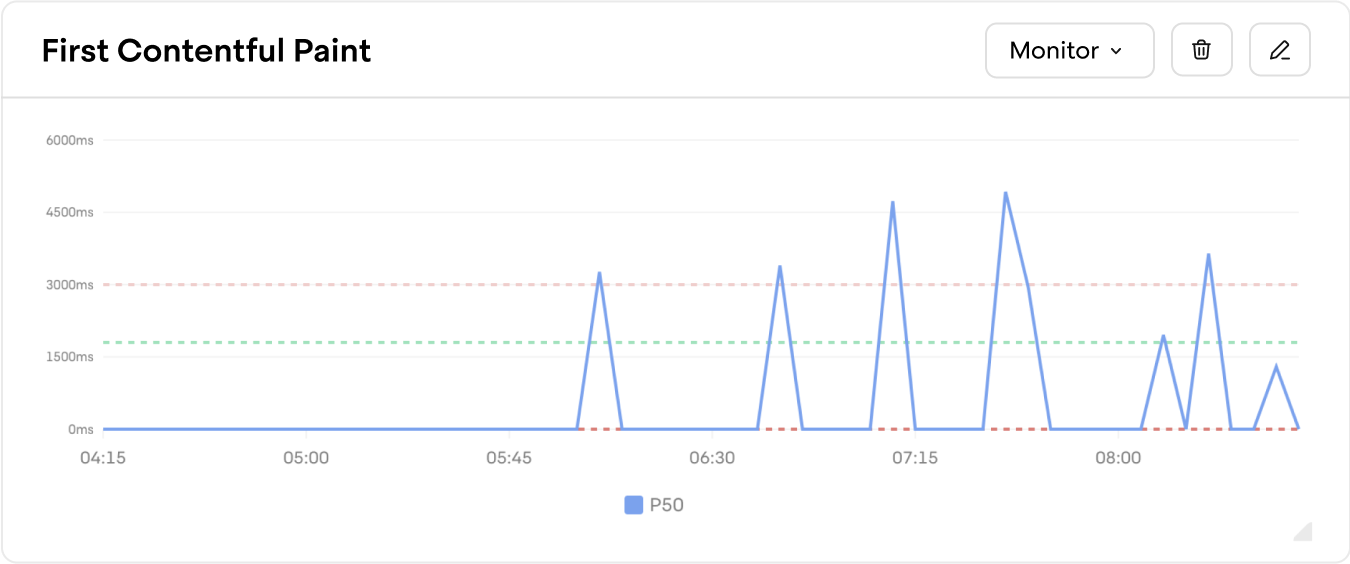
Additionally, users can see a timeline of web vitals over time, aggregated across your users.
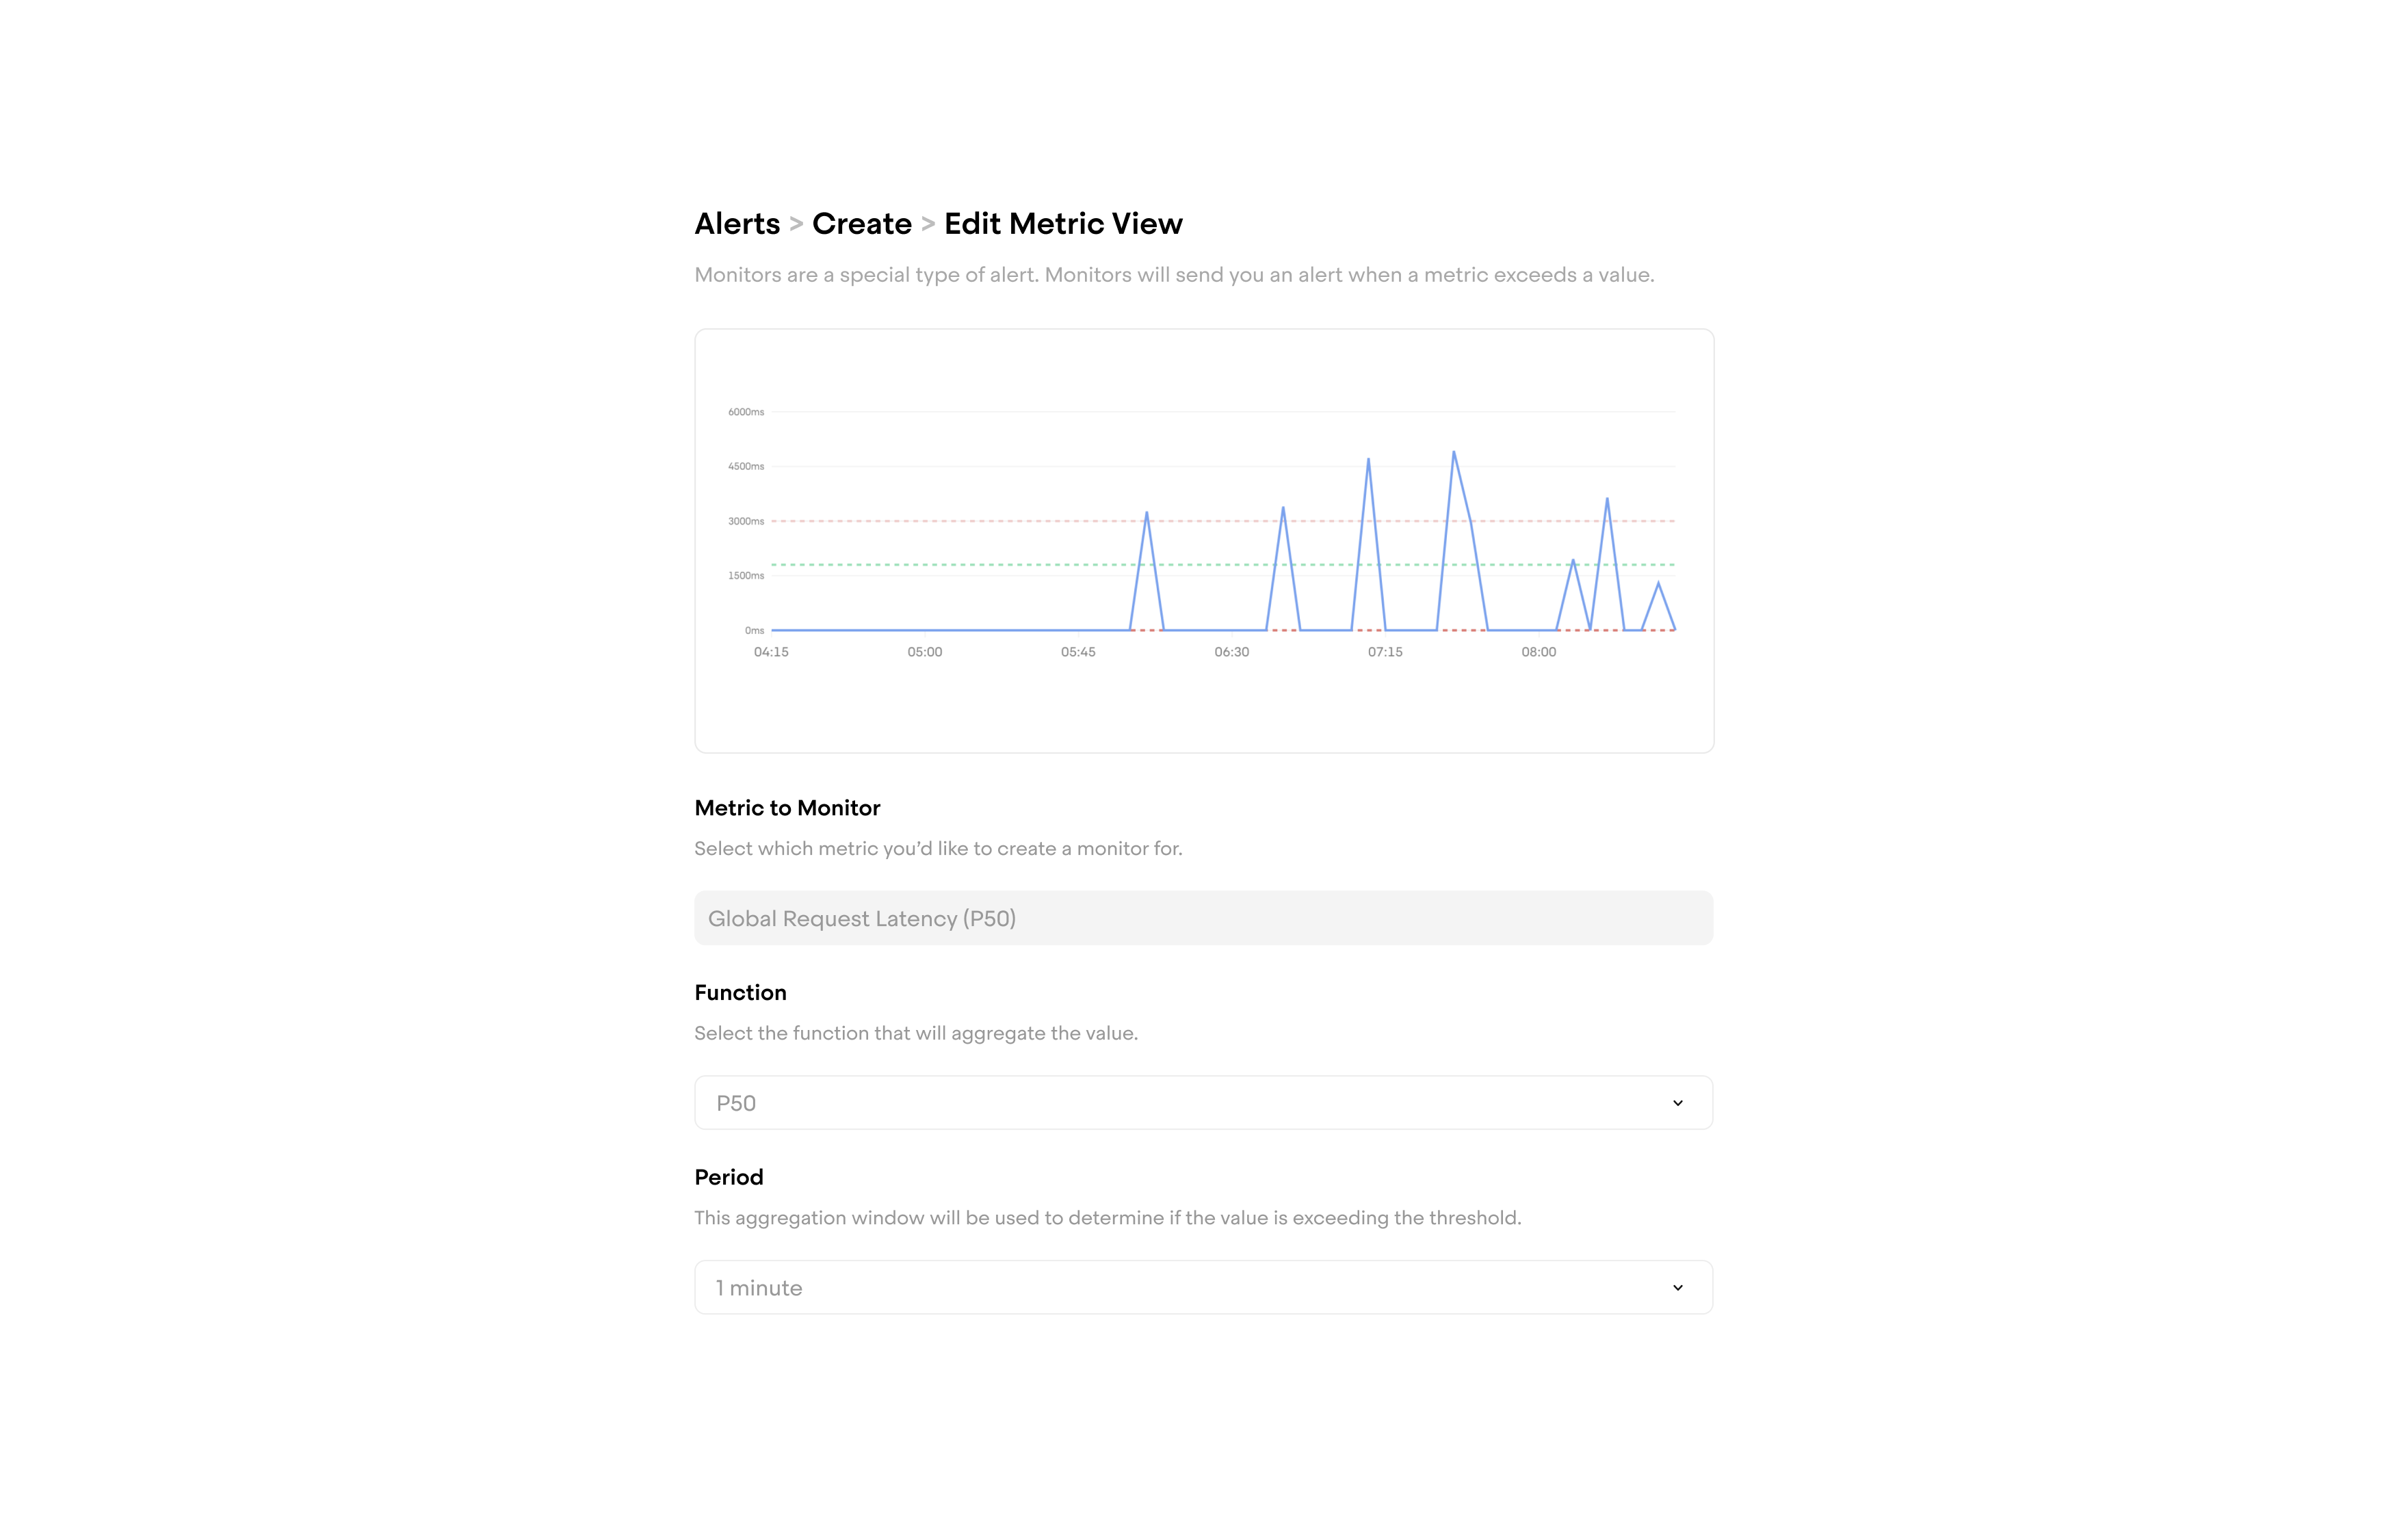
With custom alerting, you can set up alerts to notify you if your web vitals are above or below a certain threshold. By default, we provide an easy option to set alerts for standard thresholds, as recommended by the official guidelines.
Request Metrics
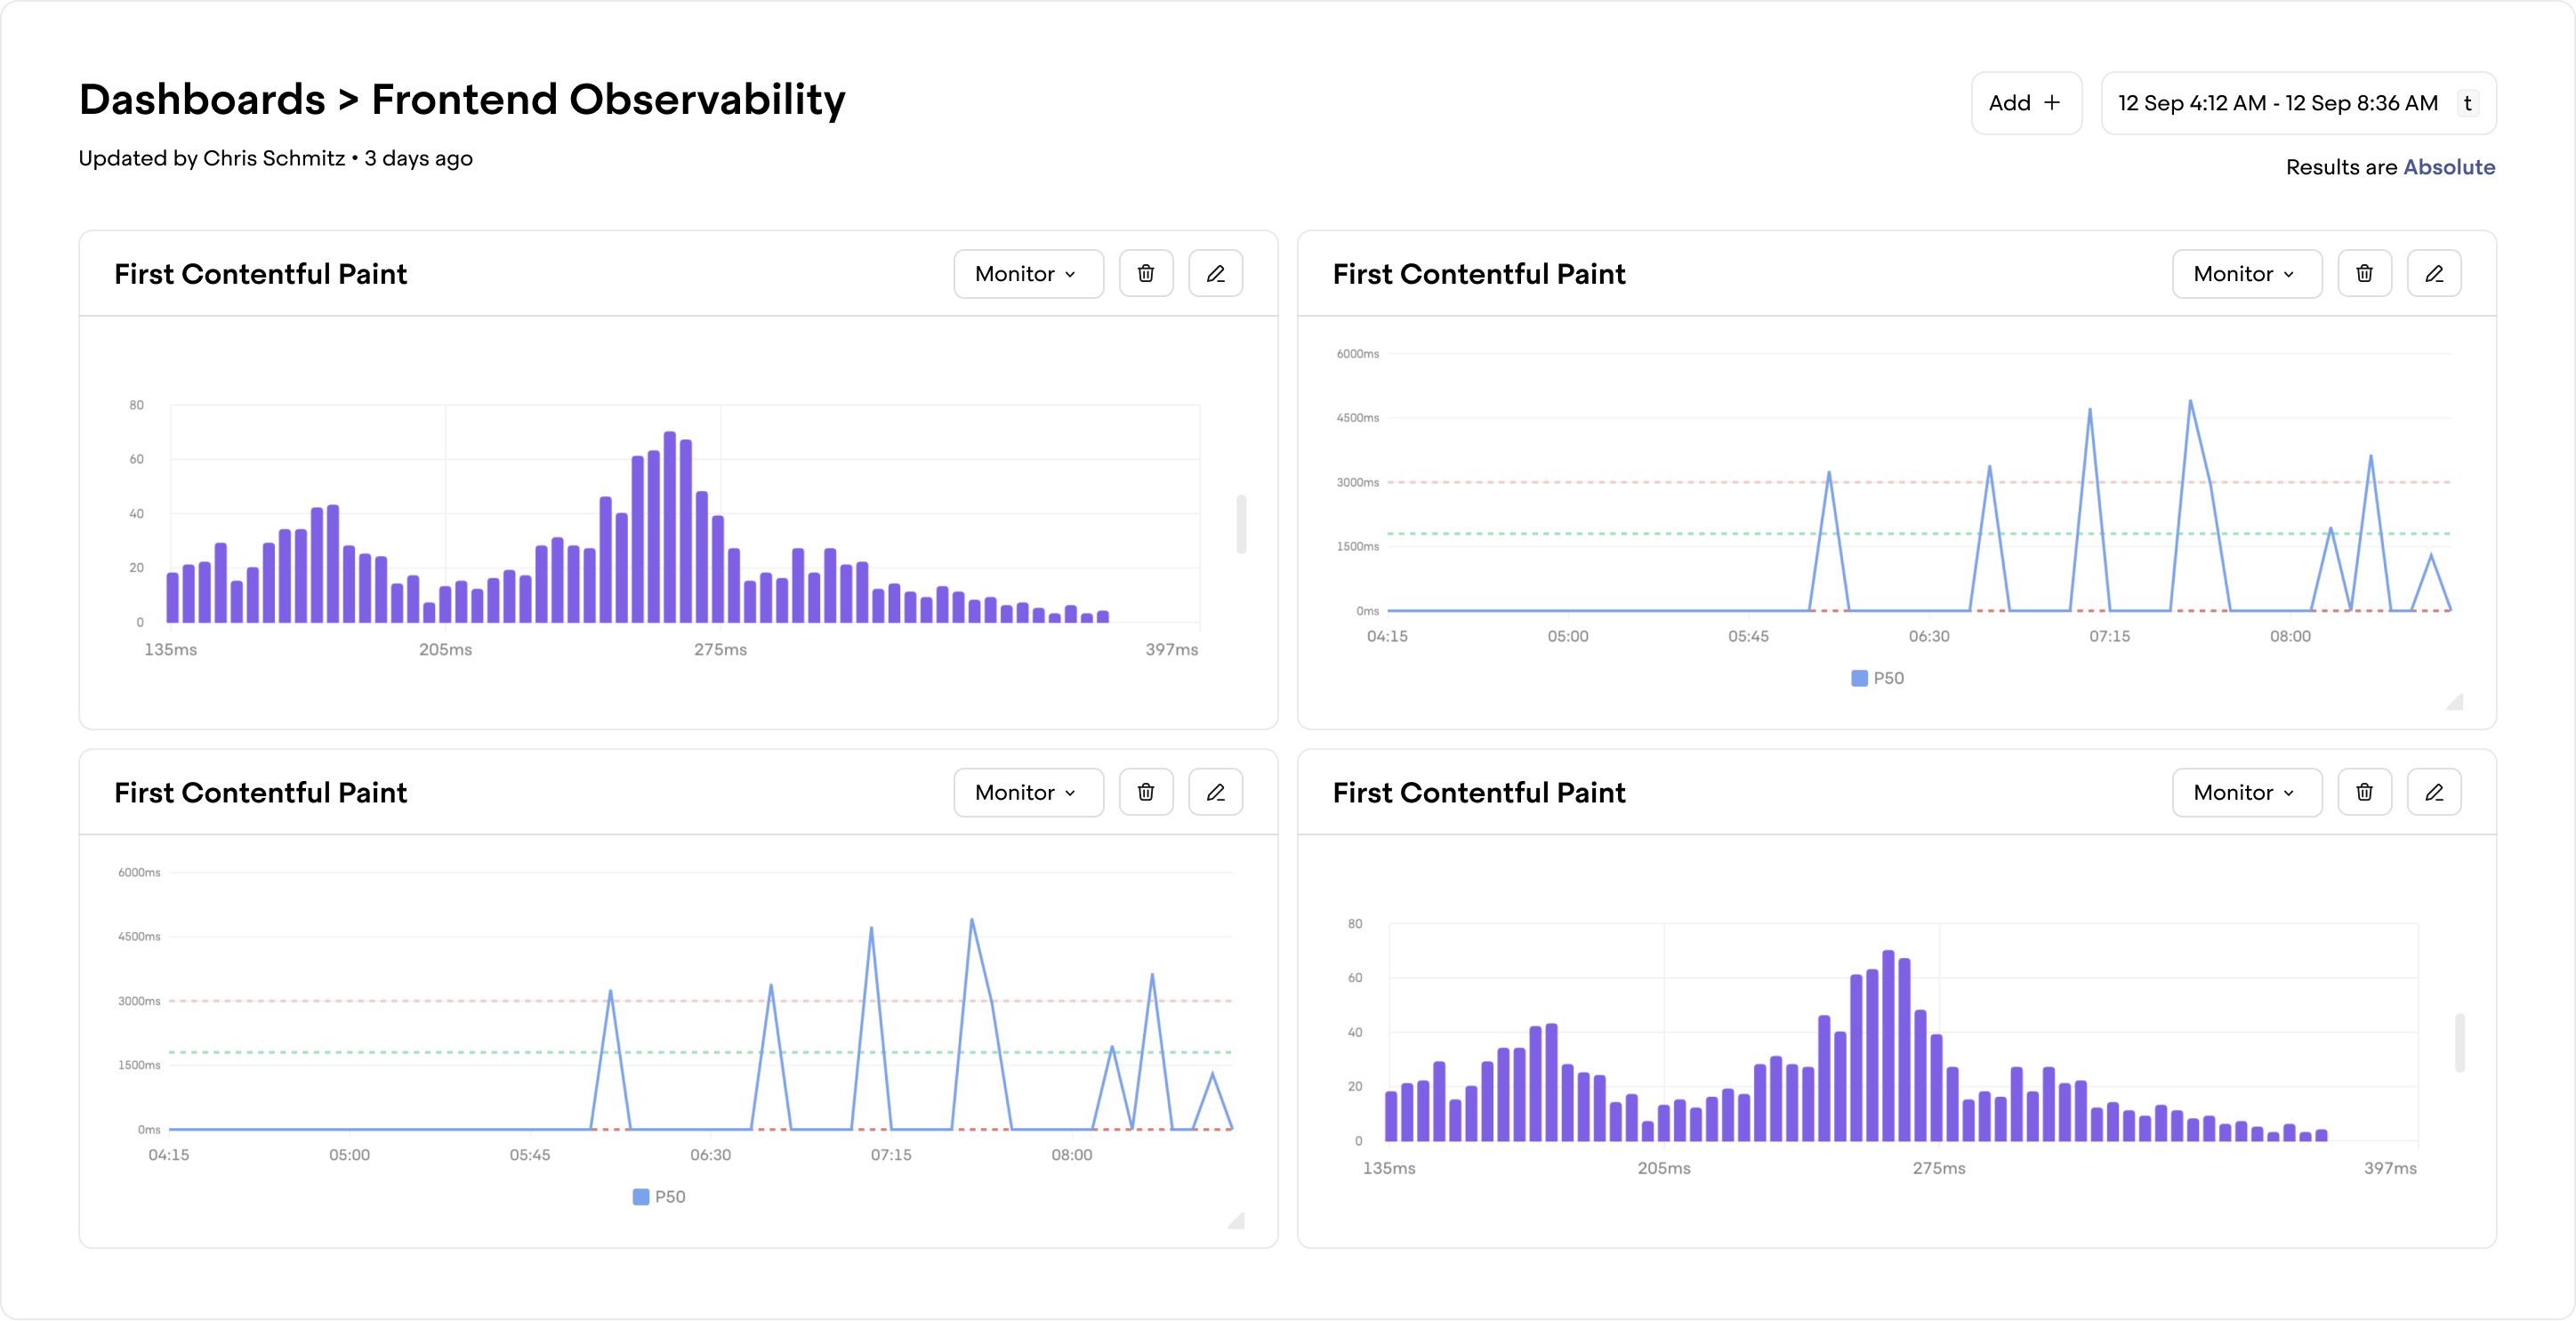
One of our users' favorite features is the ability to see network requests from a particular session in Highlight. With Request Metrics, we take this functionality a step further. Starting today, users will also be able to set up custom dashboards to track the performance of network requests over time.
Highlight users will be able to track a variety of metrics related to the performance of their app front-end. Metrics include:
- HTTP method
- request size
- response size
- HTTP request status code
- request latency
… and can be filtered based on the following attributes:
- initiator type
- URL
- GraphQL operation name
With the introduction of Frontend Monitoring by Highlight, Highlight users can now better monitor the performance of their web app, and react to any performance issues quickly. Web Vitals helps you track how quickly your app renders and measures the friction that your users experience on page load. Request Metrics gives you an idea of how quickly your front-end renders dynamic data throughout the lifecycle of your application, both for an individual session level or across users.
Check out Frontend Monitoring today! Learn more about Frontend Monitoring in our docs.


