Apr 29, 2024 • 9 min read
Next.JS Tracing on Edge Runtime with @vercel/otel

Next.js Server Traces from the Vercel Edge Runtime
Next.js is a robust web framework that seamlessly integrates frontend and backend code. This framework allows code to be centralized while efficiently distributing tasks between the browser and server, boosting site performance and supporting complex, dynamically-generated content.
A standard Next.js application's server code can be compiled into Node.js for execution on a single server or scalable architectures like AWS Lambda. Additionally, plugins enable operation in various other runtimes. A noteworthy example is the Vercel Edge runtime, which is based on the Cloudflare Workers runtime and is known for its rapid start times and cost-efficiency. However, this runtime has certain limitations, primarily its minimal support for standard Node APIs.
Before diving deeper into these runtimes, let's consider a situation where it's tough to debug code on the Edge runtime. For instance, if users face delays when sending frontend API requests to your Edge runtime handler and you're unsure why. A practical approach would be to analyze the code execution to pinpoint where delays occur. Using traces could help, as they provide a flame graph showing where the code spends most of its time. OpenTelemetry is a useful open-source tool for gathering these traces.
What is OpenTelemetry?
OpenTelemetry is an observability specification. It's a collection of tools, APIs, and SDKs used to instrument, generate, collect, and export telemetry data (metrics, logs, and traces) to help developers understand their software's performance and behavior. An important aspect of OpenTelemetry is its vendor neutrality, meaning it can be integrated with any backend of choice, enhancing its flexibility and usability in diverse environments.
Exporting Traces from the Vercel Edge Runtime
Exporting traces from the Vercel Edge Runtime involves configuring the OpenTelemetry SDK to capture and send data to a telemetry backend. The caveat though is that the normal OpenTelemetry Node.js SDK
Given the runtime's constraints with node APIs, the setup usually involves initializing an OpenTelemetry tracer, configuring an exporter that is compatible with the Edge environment, and ensuring that traces are efficiently batched and sent without overwhelming the network. With Vercel's latest work in this space, however, we can leverage the npm package @vercel/otel to connect our instrumentation hook for export. The package bundles both the edge runtime compatible @opentelemetry/webjs and @opentelemetry/nodejs depending on the Vercel runtime where the code is running, which saves a lot of xxxx when getting tracing working across runtimes. Here's. An example of the instrumentation hook.
import {OTLPHttpJsonTraceExporter, registerOTel} from '@vercel/otel'


export function register() {
    registerOTel({
        serviceName: 'my-vercel-app',
        instrumentationConfig: {
            fetch: {
                propagateContextUrls: ['*'],
            },
        },
        attributes: {
            'highlight.project_id': 'YOUR_PROJECT_ID',
            'highlight.source': 'backend',
        },
        traceExporter: new OTLPHttpJsonTraceExporter({
            url: 'https://otel.highlight.io:4318/v1/traces',
        }),
        spanProcessors: [
            new BatchSpanProcessor(
                new OTLPHttpJsonTraceExporter({
                    url: 'https://otel.highlight.io:4318/v1/traces',
                }),
            ),
        ],
    })
}


Before Next.js 15, the instrumentation is experimental, so you will have to enable it explicitly:
const {withHighlightConfig} = require('@highlight-run/next/config')


/** @type {import('next').NextConfig} */
const nextConfig = {
    experimental: {
        instrumentationHook: true,
    },
}


module.exports = withHighlightConfig(nextConfig)
Trace Propagation from the Browser
Trace propagation from the browser is also crucial. Implementing trace propagation involves injecting trace IDs into HTTP headers or websockets and ensuring that these IDs are consistently passed through all service layers. This setup helps maintain the trace context across asynchronous operations and service boundaries, providing a complete picture of the user journey.
Let's take our setup and extend it to forward browser trace IDs to the backend. On the browser, we'll assume we're using highlight.run for session replay which will automatically add a x-highlight-request HTTP header to backend calls. We can leverage the attributesFromHeaders setting to split the incoming header into span attributes that will be passed to your backend.
import {OTLPHttpJsonTraceExporter, registerOTel} from '@vercel/otel'


export function register() {
    registerOTel({
        serviceName: 'my-vercel-app',
        instrumentationConfig: {
            fetch: {
                propagateContextUrls: ['*'],
            },
        },
        attributes: {
            'highlight.project_id': 'YOUR_PROJECT_ID',
            'highlight.source': 'backend',
        },
        traceExporter: new OTLPHttpJsonTraceExporter({
            url: 'https://otel.highlight.io:4318/v1/traces',
        }),
        attributesFromHeaders: (carrier: any) => {
            const header = carrier['x-highlight-project'] || ''
            const [session_id, request_id] = header.split('/')
            return {
                'highlight.session_id': session_id,
                'highlight.request_id': request_id,
            }
        },
    })
}
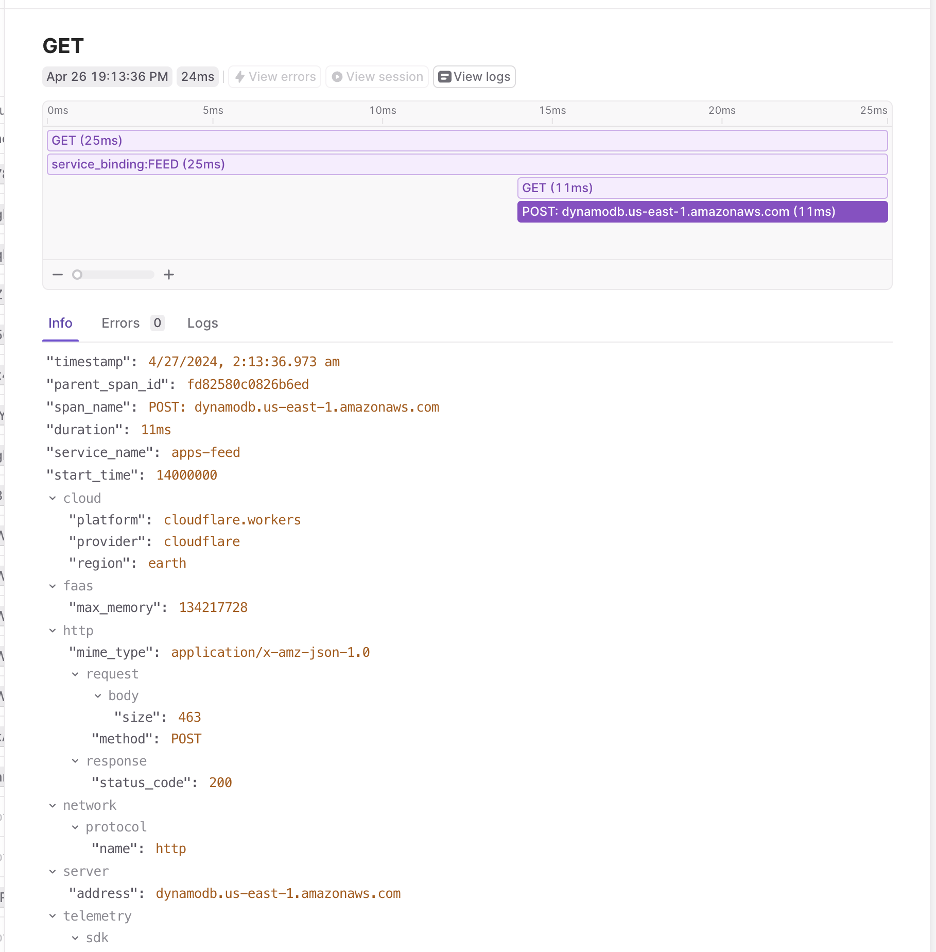
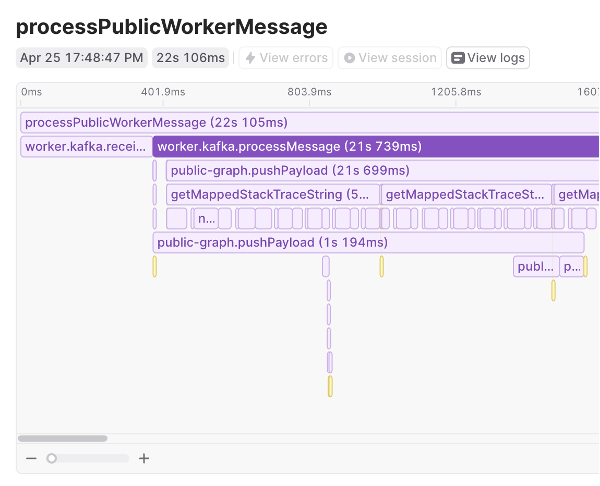
Visualizing Edge Runtime Spans in Highlight.io
Highlight.io is an observability platform that supports the visualization of spans from various runtimes, including the Vercel Edge. By integrating with OpenTelemetry, Highlight.io allows developers to view detailed visualizations of their telemetry data. This integration enables teams to quickly identify performance bottlenecks or issues within their deployments and to understand better the behavior of their applications under different conditions.