Jun 14, 2023 • 5 min read
The Network Request Details Panel
Network requests are the link between our client and server interactions. They contain a ton of critical information that helps with troubleshooting issues impacting the user experience. They are often the starting point for us when trying to understand UX and performance issues.
We recognize Highlight can do a lot to help our users understand how requests are flowing and performing in their app, and today we’re excited to announce the first in a series of improvements to how you can visualize network requests and their associated information in Highlight.
Find What Matters
The first thing you’ll notice is some refinements to how you can access and view network requests in the dev tools. Quickly filter down to requests of a certain type or status code (e.g. fetch requests with a 500 status), or use a custom search pattern to filter.
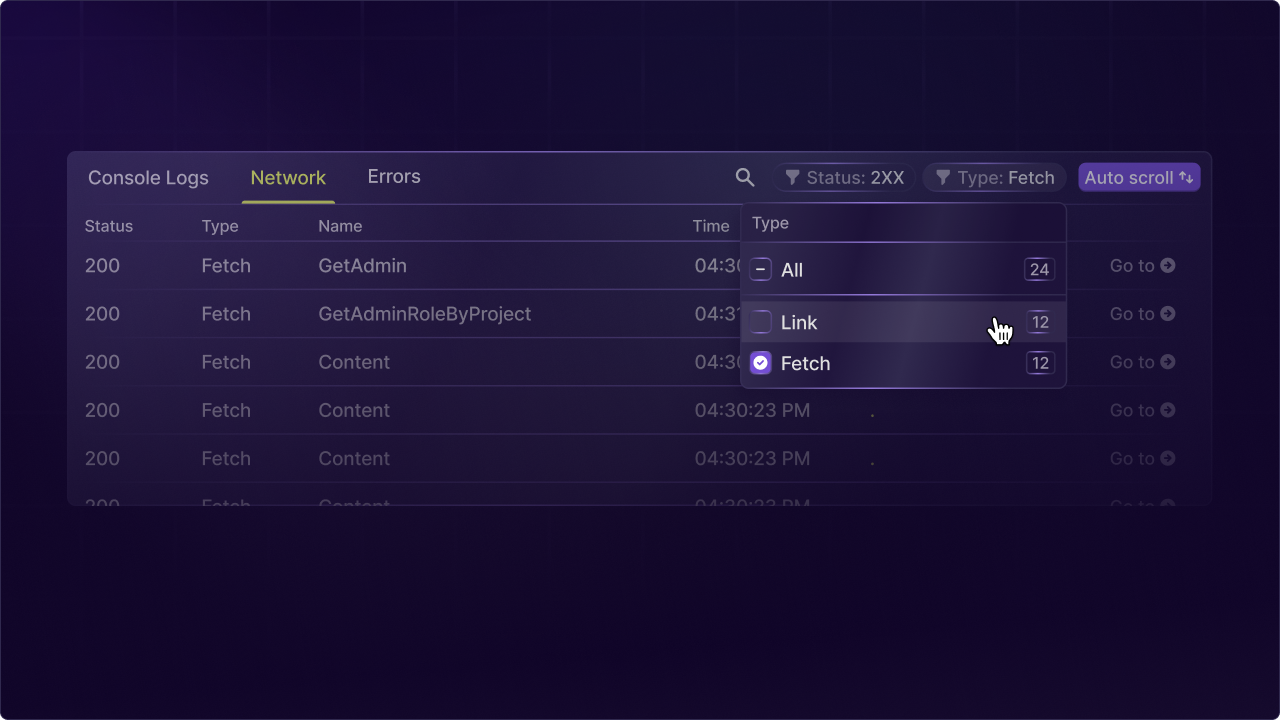
This provides a lot of information at a glance, but there’s much more data associated with a request if you’ve instrumented your backend logs and errors.
Tying It All Together
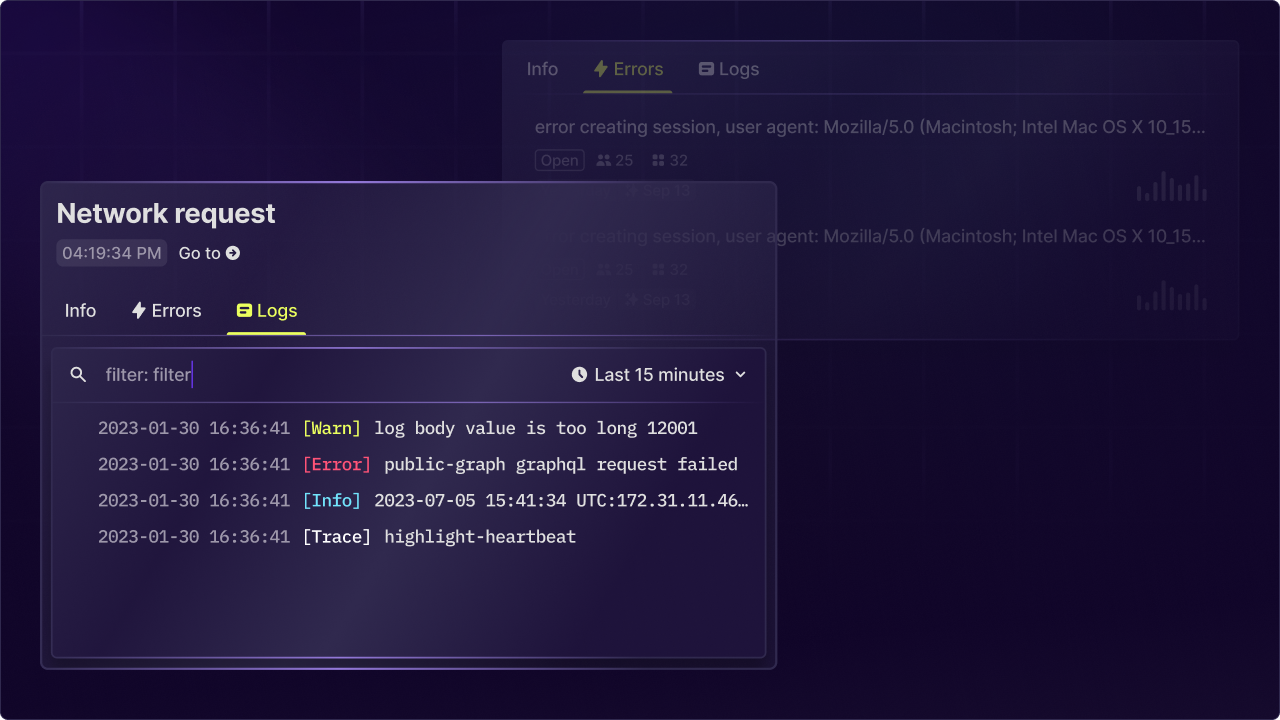
Once you navigate into a request you’ll see a new panel that integrates all the related information for the network request in one place. You’ll see tabs for the basic metadata of the request as well as any errors and logs associated. This helps provide the full picture of what happened in a request.
To Be Continued
We have more in store to help you understand what’s happening from your client interactions all the way down to your database. Here’s a glimpse from a mockup for something we have in our roadmap.
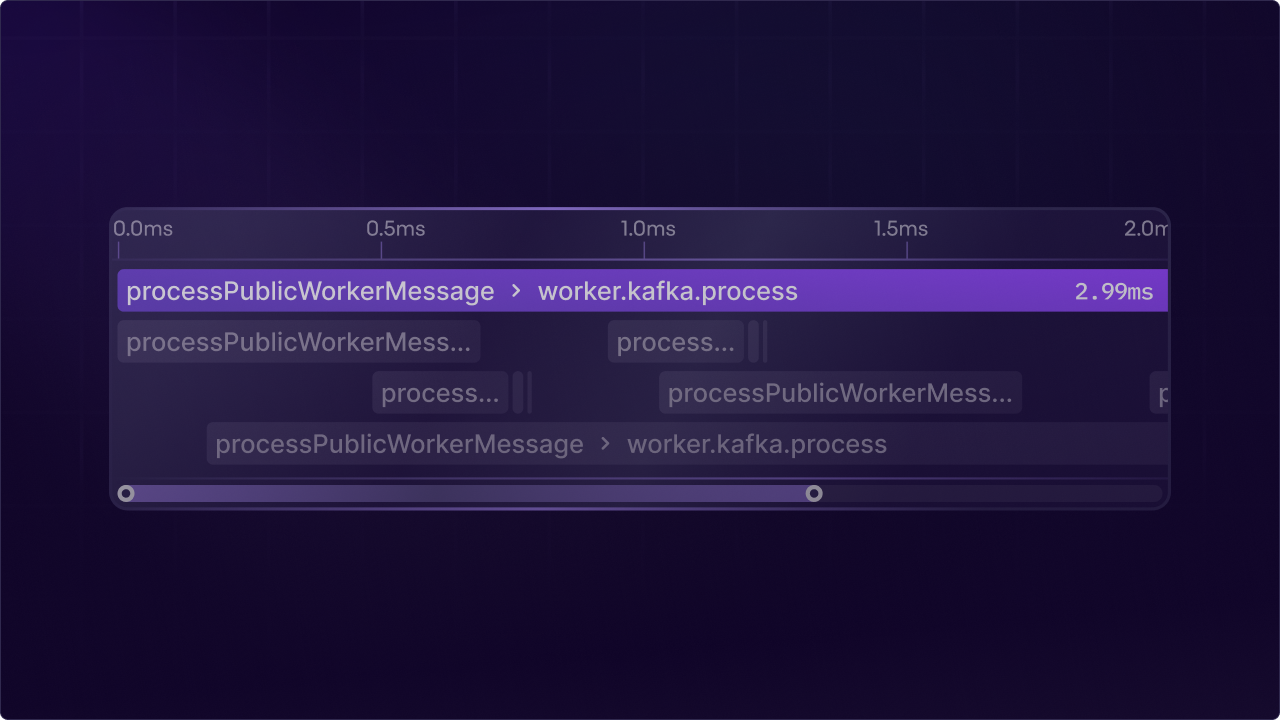
You can infer a lot about some future Highlight features from this 😉 - stay tuned for more!
Other articles you may like
Apr 29, 2024 • 9 min. read
Jun 13, 2023 • 5 min. read